
How to Read Heavy Equipment Technical Data: Key Specs for Model Comparison
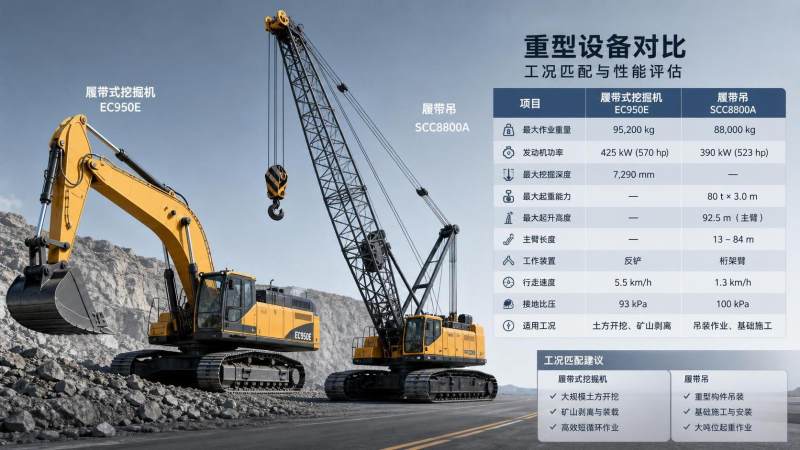
Reading heavy equipment technical data is rarely about finding the biggest number. It is about understanding what each figure means under real operating conditions, and whether two machines are being compared on equal terms.
In sectors such as tunneling, open-pit mining, heavy lifting, road building, and high-capacity haulage, a poor reading of specifications can distort cost, productivity, and safety assumptions from the start.
That is why model comparison has become more technical. The market now includes hybrid powertrains, digital control systems, remote operation features, and highly specialized duty profiles that simple brochure summaries cannot explain.
For decision work shaped by the kind of intelligence focus seen at TF-Strategy, heavy equipment technical data is not just a product sheet. It is a compact map linking machine physics, site methods, lifecycle cost, and project risk.
What technical data is really telling you
At a basic level, technical data describes measurable machine performance. That includes dimensions, weight, power, hydraulic capability, structural limits, cycle ratings, and operating environments.
More importantly, it shows design intent. A machine built for continuous quarry loading will publish numbers differently from one designed for intermittent urban lifting or constrained tunnel support work.
This is where many comparisons fail. Two models may look similar by size class, yet be optimized for different materials, travel distances, gradient limits, or attachment configurations.
So the first rule in reading heavy equipment technical data is simple: read every figure together with its test condition, configuration, and intended duty cycle.
Why accurate reading matters more now
Heavy industry is under pressure from tighter project schedules, energy transition goals, emissions controls, and stricter safety expectations. These pressures make superficial comparison far more expensive than before.
A crawler crane chosen by headline lifting capacity alone may lose efficiency once boom length, radius, wind limits, and counterweight transport constraints are included.
An ultra-large excavator may advertise strong breakout force, yet actual loading performance can still be limited by bucket fill factor, swing speed, or hydraulic recovery during repetitive cycles.
For TBM programs, mining fleets, and large road machinery, the same pattern holds. Reliable interpretation of heavy equipment technical data now supports better TCO forecasting and more realistic production planning.
The core specifications that deserve attention
Not every number has equal value. Some specifications are foundational, while others only become meaningful when linked to a specific jobsite method.
Powertrain and energy performance
Engine power, torque curve, rated speed, and fuel or energy consumption should be read together. Peak horsepower alone says little about sustained work under load.
For electric or hybrid units, battery capacity, charging windows, regeneration strategy, and power availability across a full shift become equally important.
Operating weight and ground interaction
Operating weight affects transport planning, ground bearing pressure, traction, structural stability, and road compliance. It also changes with attachments, liners, fluids, and optional systems.
In soft ground or elevated work zones, weight distribution matters more than gross mass alone. That distinction is often hidden in the notes.
Hydraulic flow and pressure
Hydraulic flow affects speed. Hydraulic pressure affects force. Real attachment performance depends on both, along with thermal management and control response.
This is especially relevant for excavators, road machinery, and specialist tunnel support systems where auxiliary circuits may drive production-critical tools.
Capacity ratings and working envelope
Bucket size, payload, hopper volume, paving width, lifting capacity, or cutterhead diameter should always be tied to actual material density and site geometry.
A larger nominal capacity can underperform when travel routes, swing angles, tunnel clearances, or feed consistency reduce effective output.
How context changes the meaning of specs
The same data point can support very different conclusions depending on the application. That is why heavy equipment technical data should never be separated from site reality.
In mountain tunneling, cutterhead thrust and torque are only part of the picture. Geology variability, spoil handling, segment logistics, and maintenance access can shift the best machine choice.
In open-pit mining, excavator and dump truck matching matters as much as standalone performance. Bucket payload, truck body volume, spotting time, and haul road grade affect fleet efficiency together.
For crawler cranes, ground preparation, transport piece limits, assembly time, and site congestion can outweigh a theoretical lifting advantage on paper.
Road machinery presents a similar challenge. Paving width, screed stability, compaction frequency, and material consistency often matter more than maximum travel speed.
Reading beyond the headline numbers
Manufacturers usually present best-case values first. That is reasonable, but comparison work should move quickly into the footnotes, optional configurations, and rating standards.
Check whether the published values use standard buckets, full fuel, standard shoes, ideal material, or restricted operating ranges. Small assumptions can create large ranking errors.
Also confirm whether values are static, dynamic, gross, net, nominal, or maximum. These labels are not cosmetic. They define how usable the number really is.
This is one reason intelligence-led platforms such as TF-Strategy are useful in the background. They connect raw specification reading with methodology, market trends, and operating logic across global infrastructure projects.
Signals often missed in comparison sheets
- Altitude derating for engines and cooling systems.
- Temperature effects on battery performance or hydraulic viscosity.
- Wear part life under abrasive rock or extreme haul conditions.
- Transport dimensions that influence permitting and mobilization cost.
- Software functions that improve repeatability, diagnostics, or remote control.
A practical method for model comparison
A sound review process usually starts with the job, not the machine. Define the material, shift pattern, site limits, climate, transport route, and required production outcome first.
Then build a comparison matrix using only specifications that affect the assignment. This keeps attention on relevant heavy equipment technical data instead of attractive but low-value numbers.
A useful matrix often includes four layers: performance, compatibility, operating cost, and risk. That structure helps reveal when the strongest machine on paper is not the strongest fit.
In practice, the most reliable decisions come from combining manufacturer data, field references, service considerations, and broader market intelligence on component availability and technology direction.
Questions worth asking before ranking models
- Are all compared models configured the same way?
- Which specifications are measured, and which are estimated?
- Do the ratings reflect continuous duty or short test intervals?
- What site constraints could neutralize a paper advantage?
- How will maintenance intervals affect annual availability?
Where to look next
Once the core heavy equipment technical data has been interpreted correctly, the next step is to connect those numbers with project strategy.
That means checking fleet matching, energy pathway, digital integration, spare parts risk, and the likely impact of changing regulations or construction methods.
For large capital equipment, technical comparison should end with a shortlist, not a final answer. Field validation, operating references, and lifecycle assumptions still need to be tested.
A disciplined reading of heavy equipment technical data creates that shortlist on stronger ground. It turns specifications into a decision framework, not just a sales document.
The most useful next move is to refine a model comparison sheet around real duty conditions, then verify each critical number against application notes, service implications, and project-specific constraints.
Related News
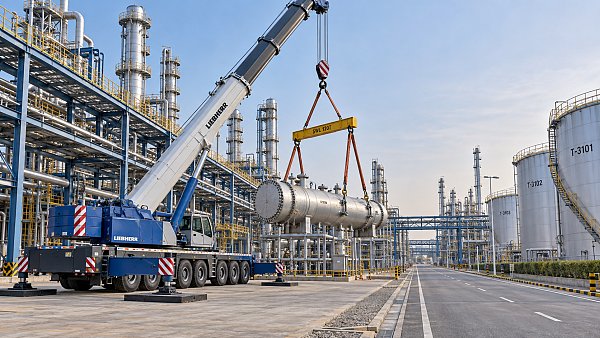
 Oct 15, 2026Crane Selection for Petrochemical Turnarounds: Capacity, Radius, and Site AccessExplore petrochemical lifting solutions cranes can deliver, with expert guidance on capacity, working radius, and site access to help you plan a safer, more efficient turnaround.
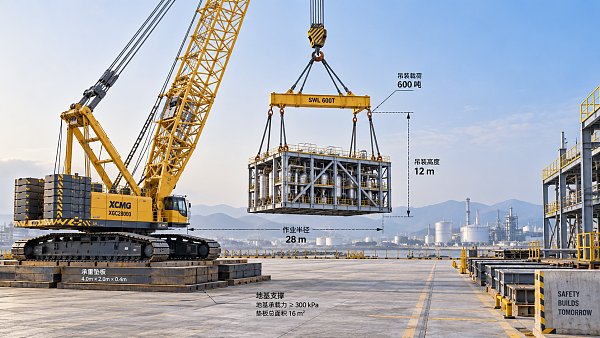
 Oct 14, 2026High-Capacity Heavy Lifting Solutions: Matching Load, Radius, and Ground ConditionsDiscover heavy lifting solutions high capacity projects demand—compare load charts, working radius, and ground conditions to select a feasible, cost-effective system.
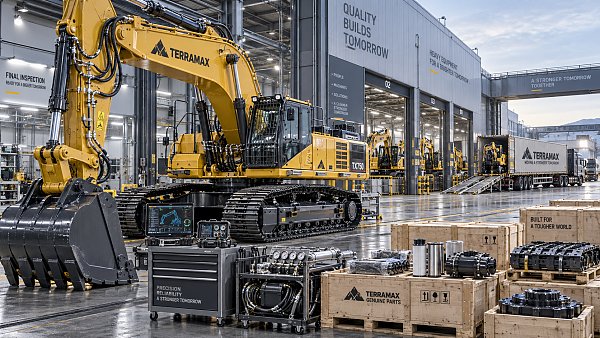
 Oct 13, 2026OEM Equipment Suppliers in Europe: Vetting Quality, Lead Times, and SupportCompare OEM equipment Europe suppliers on quality, lead times, and after-sales support. Discover practical vetting steps to reduce downtime and buy heavy equipment with confidence.
 Oct 12, 2026How to Assess a High-Altitude Mining Equipment Manufacturer for Remote ProjectsHigh altitude mining manufacturer assessment guide: compare derating, cold-climate reliability, remote service, parts resilience, and lifecycle risk for smarter project decisions.

Ms. Elena Rodriguez
Weekly Insights
Stay ahead with our curated technology reports delivered every Monday.