
Heavy Equipment Digitalization in North America: Where Fleet ROI Is Actually Coming From
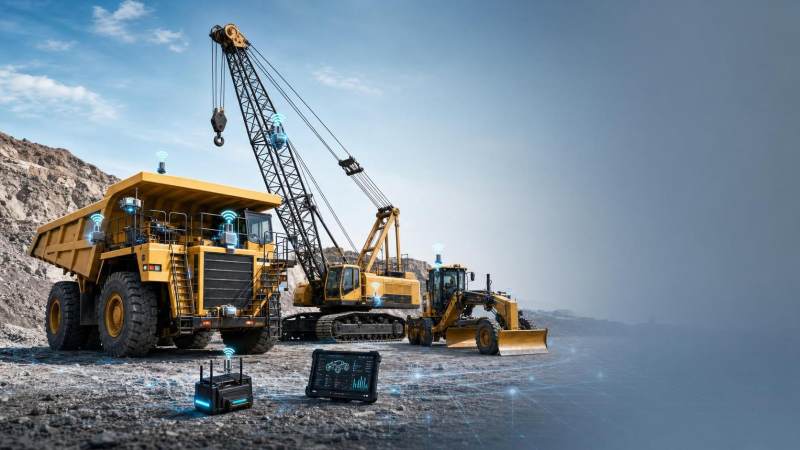
Heavy equipment digitalization in North America: what is actually driving ROI?
Heavy equipment digitalization in North America has moved past pilot-stage excitement. The serious discussion now is about cash flow, asset utilization, and capital discipline.
That shift matters because fleets are larger, jobsites are more complex, and equipment downtime is far more expensive than many plans assume.
Across tunneling, mining, lifting, and road construction, returns usually come from four places. They are uptime, fuel efficiency, maintenance timing, and tighter execution against schedule.
In other words, heavy equipment digitalization North America is valuable when it changes operating behavior, not when it simply adds more screens.
This is also why intelligence platforms such as TF-Strategy matter. Digital decisions improve when fleet data is read alongside machine physics, job methods, and market demand signals.
The practical question is no longer whether to digitalize. It is where the next dollar of fleet ROI is most likely to come from.
Is fleet ROI mainly coming from software visibility, or from operational control?
More often, the return comes from operational control. Visibility is only the first layer, and by itself it rarely pays back a program.
A dashboard may show idle hours, harsh braking, cutter wear, or crane utilization gaps. The financial gain appears only when teams act on that information consistently.
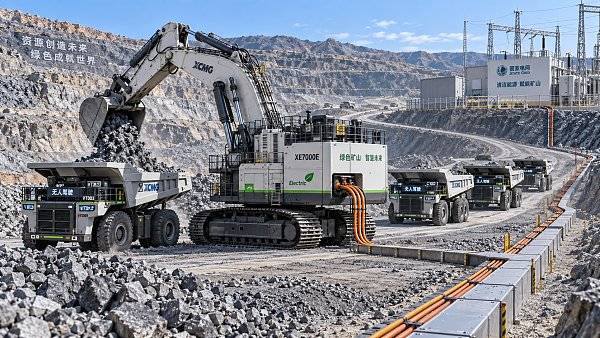
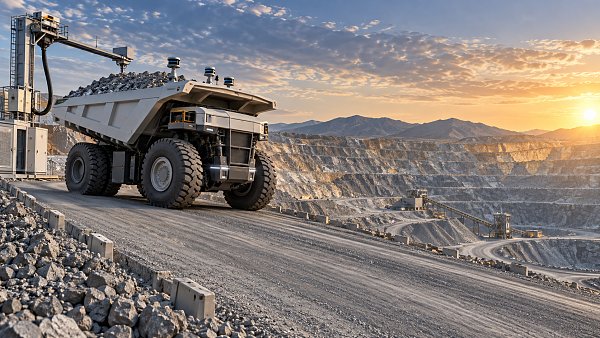
For mining dump trucks, that might mean rerouting haul cycles to reduce queue time. For crawler cranes, it can mean better lift sequencing and fewer standby hours.
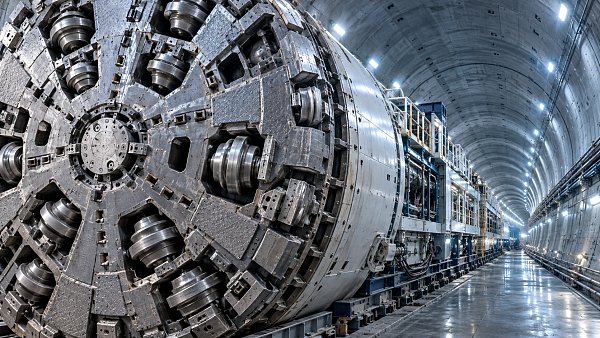
In TBM operations, digitalization often pays off by linking boring rate, cutter head wear, geology, and maintenance windows. That prevents small deviations from becoming major stoppages.
Road machinery offers another clear example. Mat temperature, paving speed, and compaction timing can be measured in real time, but the value arrives when rework drops.
So the better question is this: can the data change dispatch, maintenance, operator behavior, or site coordination within the same shift?
If the answer is no, the digital layer is informative, but not yet commercial.
Which use cases usually produce the fastest payback in North American fleets?
The fastest payback tends to come from high-cost assets with measurable downtime. That is why heavy equipment digitalization North America often starts with mixed fleets in demanding environments.
The table below summarizes where ROI typically becomes visible first.
In practice, predictive maintenance is often the cleanest first win. A single avoided failure on a TBM support system or ultra-large excavator can justify the deployment.
Fuel optimization is close behind, especially where machines spend long hours idling in queues, warm-up cycles, or under poor dispatch coordination.
The common pattern is simple. Digital systems pay faster when the baseline waste is already expensive and visible.
How do you tell whether a digital investment will improve TCO or just add another platform?
A useful test is to tie each feature to one operating decision. If a tool does not change a decision, it is hard to count it in TCO improvement.
For example, real value appears when telematics data triggers service planning, parts stocking, shift allocation, or operator coaching. Those actions affect cost structure directly.
Another sign is integration depth. Heavy equipment digitalization North America becomes more effective when machine data connects with maintenance systems, project controls, and fuel records.
Without that link, teams often create parallel reporting routines. Administrative burden rises while operational improvement remains shallow.
It also helps to separate headline claims from fleet reality. A vendor may promise broad gains, but decision quality depends on asset class, duty cycle, and site conditions.
This is where sector intelligence earns its place. TF-Strategy’s focus on TBM systems, open-pit mining, crawler cranes, road machinery, and haulage creates a stronger basis for comparison.
When operating parameters are matched to project method, ROI estimates become far more credible.
- Ask which failure modes the system can detect early.
- Confirm whether data can be normalized across mixed brands.
- Check how quickly site teams can act on alerts.
- Measure expected savings against current maintenance and fuel baselines.
Where do companies misread the heavy equipment digitalization North America trend?
One frequent mistake is treating every asset as digitally equal. They are not. A mining truck, a crawler crane, and a paver do not create value through the same data logic.
Another mistake is assuming that more sensors mean better control. In reality, too many low-priority signals can slow response and hide the critical ones.
There is also a timing issue. Some fleets digitalize before they standardize maintenance codes, utilization definitions, or shift reporting. That weakens every downstream analysis.
The strategic risk is subtle. Management may believe the fleet is modernized while key bottlenecks remain manual, fragmented, or delayed by poor data governance.
A more grounded approach is to identify one stubborn cost driver first. It may be cutter consumption, haul cycle imbalance, lift planning inefficiency, or paving rework.
Then build the digital stack around that problem, rather than around a generic innovation narrative.
What should be compared before choosing a platform or rollout model?
Before selection, compare implementation logic as carefully as software features. Two platforms may look similar in demos and behave very differently in the field.
The first comparison point is asset compatibility. North American fleets are often mixed by age, OEM, engine standard, and control architecture.
The second is data ownership and portability. If switching later becomes difficult, the digital layer can quietly increase long-term lock-in costs.
The third is deployment rhythm. Some operations benefit from a phased rollout by asset class. Others need one corridor, one mine, or one project to serve as the proving ground.
A useful decision table looks like this.
More common than expected, a moderate platform with strong execution beats a sophisticated platform that site teams rarely trust.
What is the most practical next step if ROI needs to be proven quickly?
Start with one measurable business case, one asset group, and one short review cycle. That keeps heavy equipment digitalization North America tied to evidence rather than aspiration.
Choose a problem with hard numbers behind it. Unplanned stoppages, excessive idle fuel, delayed lifts, and recurring rework are usually strong starting points.
Then define baseline metrics before rollout. Without a clean baseline, even a useful pilot can become difficult to defend internally.
- Map the highest-cost failure or inefficiency by asset class.
- Confirm what data is already available and what is missing.
- Set a 60 to 90 day review window with operational KPIs.
- Review outcomes against fuel, uptime, repair, and schedule variance.
The broader market signal is clear. North American fleets are rewarding digital systems that improve execution under real site pressure.
For companies tracking tunneling, open-pit mining, heavy lifting, and road machinery, the strongest decisions usually combine field data with sector intelligence.
That is the practical value of a platform like TF-Strategy. It connects machine behavior, engineering method, and market direction, so digital investment can be judged with more precision.
If the goal is better TCO, not just better reporting, the next step is to audit where operational losses truly originate and build the digital roadmap around those points.
Related News
 Oct 13, 2026OEM Equipment Suppliers in Europe: Vetting Quality, Lead Times, and SupportCompare OEM equipment Europe suppliers on quality, lead times, and after-sales support. Discover practical vetting steps to reduce downtime and buy heavy equipment with confidence.
 Oct 12, 2026How to Assess a High-Altitude Mining Equipment Manufacturer for Remote ProjectsHigh altitude mining manufacturer assessment guide: compare derating, cold-climate reliability, remote service, parts resilience, and lifecycle risk for smarter project decisions.
 Oct 11, 2026What Drives TBM Cutter Head Material Cost and Life-Cycle Value?Cutter head material cost explained: compare TBM alloys, wear protection, downtime risk, and life-cycle value to choose the most reliable, cost-effective solution.
 Oct 14, 2026When Does Mining Hauling Equipment Need Repair, Rebuild, or Full Overhaul?Mining hauling equipment repair and overhaul market insights: learn when to choose repair, rebuild, or full overhaul to improve safety, uptime, and lifecycle value.

Prof. Marcus Chen
Weekly Insights
Stay ahead with our curated technology reports delivered every Monday.